Mechanical components are often designed to withstand repeated loads during their service life. However, a component can fail even when the applied stress remains below the material's yield strength. This type of failure is known as fatigue failure and it can occur after thousands or even millions of loading cycles.
That’s where the S-N curve comes in. It tells you how many cycles a material can take at a given stress amplitude before it cracks & fails. Engineers check it when designing shafts, springs, gears, bridges, aircraft structures, pretty much any part that gets loaded again & again.
In this article, we will discuss what an S-N curve is, its formula, how to read its diagram and how it is used in fatigue analysis. We will also look at how the curve is developed for a material and why steel and aluminium generally show different fatigue behavior.
What Is S-N Curve?
An S-N curve is a graph that shows how many stress cycles (N) a material can survive before failing at a given stress level (S). It is also known as the Wöhler curve. The higher the stress you apply in each cycle, the fewer cycles the part will last. Lower the stress and life goes up fast. At some low enough level, certain materials can run almost forever.
In a typical fatigue test, a specimen is subjected to repeated loading until a crack causes the specimen to fracture or it reaches a defined failure criterion. The stress level & the number of cycles endured are recorded. Repeating this process at different stress levels produces the data used to plot the S N curve.
The curve comes from lab testing on small polished specimens that are loaded back and forth until they break. Each test gives one point on the graph. Put enough points together and you get a curve you can actually design with. Engineers use it mostly for high-cycle fatigue where stresses stay in the elastic range & failure takes more than about 10,000 cycles.
S-N Curve Formula
The most common formula for the S-N curve is Basquin’s equation, which describes the sloping part of the curve.
σa = σf’ (2N)^b
Here is what each term means:
σa is the stress amplitude, meaning half of the stress range in a cycle.
σf’ is the fatigue strength coefficient. It is close to the true fracture strength of the material, though it is really a fitted constant.
N is the number of cycles to failure. The 2N inside the bracket counts reversals, since one cycle has two of them.
b is the fatigue strength exponent, also called Basquin’s exponent. It is the slope of the line on a log-log plot and usually falls between about minus 0.05 & minus 0.12 for metals.
You will also see a simpler version written as S = A N^b, or N S^m = C, depending on the textbook or standard. They all say the same thing. This part matters: the formula only works in the finite life region. It will not describe the flat part of the curve where the endurance limit sits.
S-N Curve Diagram
The S-N curve diagram consists of a horizontal axis showing the number of cycles to failure and a vertical axis showing stress amplitude. The cycle axis is nearly always logarithmic, because life can range from a few hundred cycles to hundreds of millions. The stress axis can be linear or logarithmic.
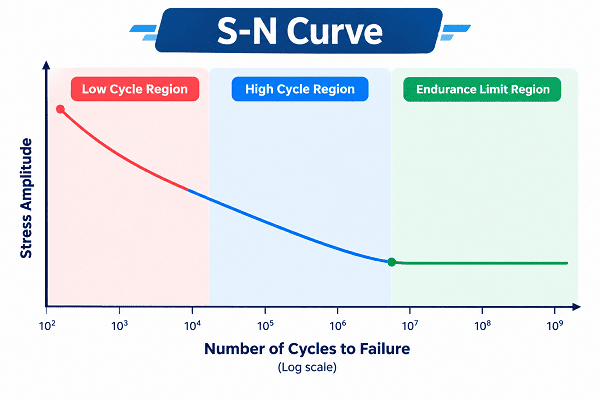 The curve starts at the top left. Here stresses are high and life is short. As you move right, the curve drops down in a fairly straight slope, then often flattens out.
There are a few zones worth knowing:
-
Low cycle region: Roughly below 103 to 104 cycles. Stresses here are high enough to cause plastic deformation, and the S-N approach is not very reliable in this area. Strain-based methods do better.
-
High cycle region: This is the sloping straight line section where Basquin’s equation applies. Most real design work happens here.
-
Endurance limit region: For some materials, mainly steels, the curve levels off at around 106 to 107 cycles. Below that stress level the part is expected to survive indefinitely.
Aluminium and other non ferrous metals usually do not show this flat portion. Their curve keeps sloping down, so a fatigue strength is quoted at a chosen life, often 5×10⁸ cycles.
Fatigue Analysis of S-N Curve
Fatigue analysis with an S-N curve means finding the stress in your component and then reading off how many cycles it can take at that stress. If the required life is longer than what the curve allows, you change the design.
The basic steps are simple. First, work out the stress amplitude & mean stress at the critical location, usually through hand calcs or finite element analysis. Second, pick the right S-N data for the material and condition. Third, correct that data for the real part, since a lab specimen is nothing like a machined component with a rough surface and a notch.
Those corrections matter more than people expect. Surface finish, size, load type, temperature, and reliability level all pull the endurance limit down. Notches add stress concentration through a fatigue notch factor. A part with a clean, polished surface can last many times longer than the same part with a rough cast skin.
Mean stress is the other big one. A cycle with a tensile mean stress is harder on the material than a fully reversed one. Engineers handle this with Goodman, Gerber or Soderberg relations, and Goodman is the one you will see most often because it is on the conservative side.
When loads vary in amplitude, like on a vehicle suspension, you can pair the S-N curve with Miner’s rule. It adds up damage from each load block, and failure is predicted when the sum reaches about one. It is not perfect, but it works well enough for first estimates.
How Is a SN-Curve Created for a Given Material?
An S-N curve is created by fatigue testing many identical specimens at different stress levels and recording how many cycles each one lasts. The results are plotted and a best-fit line is drawn through them.
The usual machine is a rotating bending test, though axial and other setups exist too. A polished specimen is held in the machine, loaded to a set stress, and run until it breaks or reaches a cutoff, often 107 cycles. Tests that reach the cutoff without breaking are marked as run-outs.
You start with a high stress, maybe 70 percent of the ultimate strength, and see how long the specimen lasts. Then you reduce the stress on the next specimen and repeat. The number of specimens is usually 10-15 or more, depending on statistical confidence. There is a lot of variation in fatigue data. The difference in life between two samples from the same batch at the same stress may be 10x or greater.
Due to this scatter, the data is fitted in the form of regression of log N against log S and frequently curves are plotted for various percent survivals, e.g., 50 percent, 90 percent, and 99 percent. For critical parts, the lower probability curves are the ones that count.
The staircase method is common for finding the endurance limit. You raise or lower the stress by a small step depending on whether the last specimen failed or survived. It saves specimens and gives a decent estimate.
S-N Curve for Steel and Aluminium
For steel, the S-N curve bends into a flat line at roughly 106 to 107 cycles. That flat level is the endurance limit, about 40 to 50 percent of the ultimate tensile strength, up to a cap of around 700 MPa for strong steels. For aluminum, the curve keeps sloping down with no flat part. So fatigue strength is quoted at a fixed life like 5×10⁸ cycles usually around 30 to 40 percent of the ultimate strength.
Steel has a clear knee in its S-N curve while aluminium does not. That one difference changes how you design with each. In practice, corrosion or overloads can erase this benefit, so do not rely on it blindly.
Aluminium keeps losing strength as cycles pile up. There is no true infinite life, so designers pick a target life and read the allowable stress at that point. One commonly used criterion is the stress at 5×10⁸ cycles, which is approximately 30-40% of the ultimate strength for many alloys.
This renders aluminium more challenging for such fatigue sensitive applications as aircraft structures and bike frames. Many times, more is required in terms of size, detail, and surface. Lightweight steel is more forgiving under low stress. It's a compromise between weight & fatigue strength.
Conclusion
The S N curve is a practical engineering tool that can be used to estimate the fatigue life of a material when it undergoes repeated loading. It relates stress amplitude to cycles to failure and provides a means for the engineer to determine if a material will have a sufficient service life for a given stress amplitude.
The most useful S N curve for practical design is one that has been determined by reliable tests and conditions similar to those of the application. With a little attention at the design stage to material selection and fatigue, many unexpected failures can be avoided and components can be much more reliable.