When materials are subjected to stress, they undergo deformation, and studying this behavior is vital to prevent failures in structures. However, predicting how a material will react under various loads can be challenging without a proper reference. Understanding how materials respond to force is essential in engineering and manufacturing.
This is where the Stress-Strain Curve becomes an invaluable tool. It provides a graphical representation of a material's mechanical properties, enabling engineers to determine its strength, elasticity, and ductility. By utilizing this curve, industries can select appropriate materials, design safer buildings, and create durable products, effectively addressing the problem of material failure.
What is a Stress-Strain Curve?
A stress-strain curve is a graph that shows how a material deforms under mechanical load. It plots stress (force per unit area) on the vertical axis and strain (deformation per unit length) on the horizontal axis.
The curve reveals key properties like elasticity, yield strength, tensile strength, and fracture point. Used in industrial design and quality control, it helps engineers choose the right material for mechanical performance, ensuring components can handle expected forces without permanent deformation or failure.
Stress and Strain Formula
-
Stress (σ): Stress is defined as the internal resistance offered by a material to the external force applied to it. It is calculated as the force per unit area.
Formula of Stress:
Stress (σ)=F/A
Where:
-
σ = Stress (in Pascals, Pa or N/m²)
-
F = Applied force (in Newtons, N)
-
A = Cross-sectional area (in m²)
-
Strain (ε): Strain is the measure of deformation experienced by the body in the direction of the applied force, divided by the original length of the body. It is a dimensionless quantity.
Formula of Strain:
Strain (ε)= ΔL/L
Where:
-
ε = Strain (unitless)
-
ΔL = Change in length (in meters, m)
-
L = Original length (in meters, m)
Hooke’s Law (Relation between Stress and Strain)
Hooke's Law states the stress-strain relationship in an elastic material. Under the elastic limit, stress varies directly with strain, i.e., the material gets deformed proportionally to the force applied. This is mathematically represented as:
Stress = E*Strain
Where E is the modulus of elasticity.
Stress-Strain Curve Diagram Explained
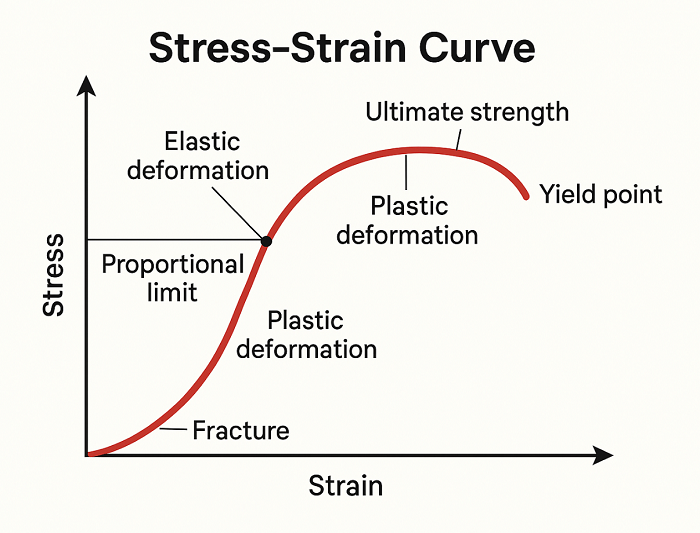
A stress-strain curve diagram visually represents a material’s response to applied force. It plots stress on the vertical axis and strain on the horizontal axis, showing key points like elastic limit, yield strength, ultimate tensile strength, and fracture. The stress strain diagram or graph helps engineers analyze material behavior and select suitable materials for industrial applications.
Explanation of Stress vs Strain Graph
The stress vs strain graph is plotted on the vertical axis, while strain is on the horizontal axis. This graph helps engineers understand material behavior for practical applications. Stress strain graph shows a linear relationship, indicating elastic behavior where the material returns to its original shape after unloading. Here is the detailed explanation:-
Proportional Limit
The proportional limit on a stress-strain graph is the stress at which the stress-strain curve deviates from a straight line, the end of the elastic region, and the start of the plastic region. In effect, it's the highest stress that a material can be subjected to without showing any sign of plasticity (it will regain its original shape when stress is released).
Elastic Region
The elastic region on a stress-strain curve is the first part of the curve where a material elastically deforms and returns to its original configuration upon removal of the applied stress. This is a region with a linear relationship between stress and strain, obeying Hooke's Law, and is limited by the yield point or elastic limit.
Yield Point
Yield point on a stress-strain graph is the point of transition from elastic to plastic behavior of a material. It's the stress value at which the material begins to deform permanently, that is, it won't come back to its original position once the loading is removed.
Plastic Region
In a stress-strain curve, the plastic area is the region where a material deforms permanently after yielding. After this point, the material will no longer revert to its original form when the applied load is removed.
Ultimate Tensile Strength
In a stress-strain graph, the ultimate tensile strength (UTS) is the maximum stress that a material can handle before it starts to neck and eventually fail. It is the peak value on the curve, which indicates when the material is under its maximum tensile stress before local deformation starts, resulting in a cross-sectional area and fracture.
Fracture Point
The point of fracture in a stress-strain curve is the location where a material fractures or breaks due to applied stress. It's the terminal point of the stress-strain curve, which marks the failure of the material in totality.
Stress vs Strain Curve: Key Differences
The fundamental difference between stress and strain is in their measurement and definition. Stress is defined as the force per unit area acting on a material, whereas strain is the deformation or change in shape of the material that occurs due to stress.
Key difference between stress and strain curve:
| Aspect | Stress Curve | Strain Curve |
| Definition | A plot showing how internal resistance changes with applied load. | A plot showing how deformation evolves under stress. |
| Y-Axis parameter | Stress (force per unit area) | Strain (change in length/original length) |
| X-Axis parameter | Often plotted against strain | Often plotted against stress |
| Curve purpose | Shows material strength, elasticity, yield point, etc. | Shows material deformation under load. |
| Units | Pascals (Pa) or N/m² | Unitless (ratio) |
| Force | Emphasizes load-bearing capacity. | Emphasizes the extent of deformation. |
| Common use | Use to determine tensile strength, elastic limit, and fracture point. | Use to analyze ductility and elongation. |
Stress vs Strain Curve for Different Materials
The stress vs strain curve for different materials shows how ductile, brittle, and polymeric materials behave under load. The following outlines how different materials behave in a stress and strain curve under various conditions –
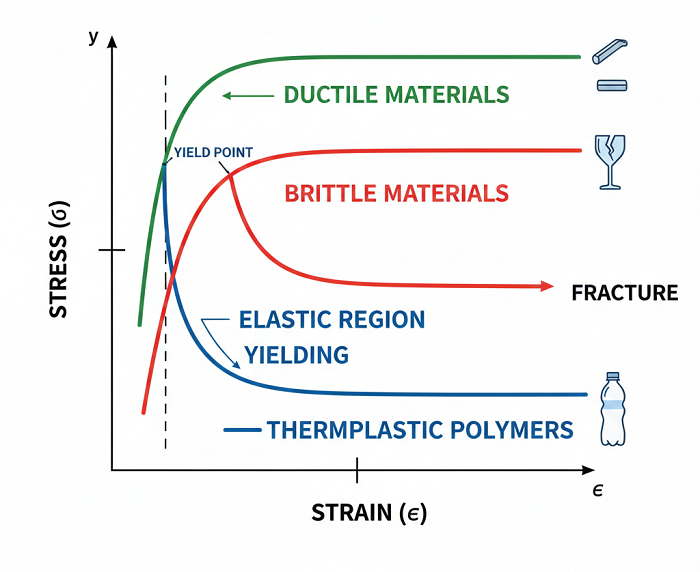
Ductile Materials
The stress-strain curve of a ductile material is generally nonlinear and has a well-defined yield point. After the yield point, the material experiences a large amount of plastic deformation before failure.
Brittle Materials
The stress-strain curve for a brittle material is linear and possesses a clear elastic limit. After the elastic limit, the material will go through a very short time of plastic deformation, but an abrupt and sudden failure ensues afterwards.
Thermoplastic polymers
The stress-strain curve for thermoplastic polymers typically exhibits a linear elastic initial region, followed by a non-linear region in which the material begins to yield and undergo plastic deformation.
Applications of Stress-Strain Curve
The primary application of the stress-strain curve is to analyze mechanical properties, including strength, ductility, and toughness of materials, which are crucial for designing reliable and safe structures.
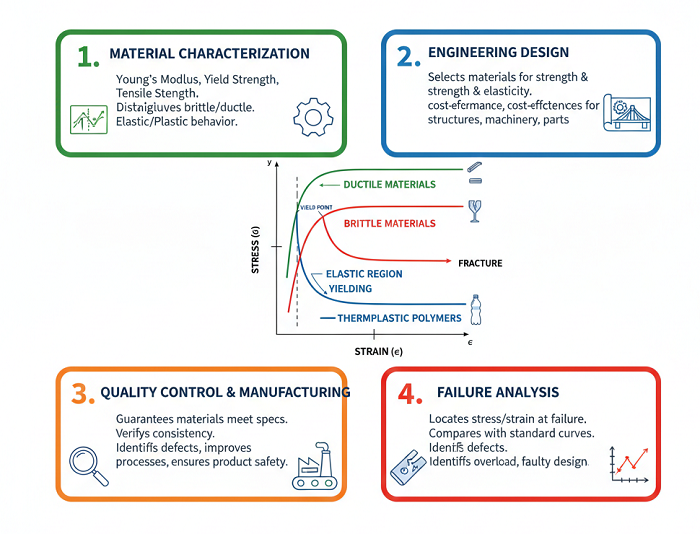
Material Characterization
The stress-strain curve is crucial for the characterization of the material because it tells important mechanical properties such as Young's modulus, yield strength, tensile strength, and ductility. It distinguishes between brittle and ductile materials and determines their elastic and plastic behavior, and aids engineers in selecting appropriate materials based on the intended application.
Related: Tensile Strength vs Yield Strength: Know the Difference
Engineering design and material selection
The stress-strain curve facilitates engineering design and material selection by delivering fundamental mechanical properties such as strength, elasticity, and ductility. Designers utilize this information to select materials able to resist anticipated loads without failure for the purpose of ensuring safety, performance, and cost-effectiveness in structures, machinery, and parts in different engineering applications.
Quality Control and Manufacturing
In manufacturing and quality control, the stress-strain curve guarantees materials are within mechanical specifications. It confirms consistency in properties such as strength, ductility, and elasticity between production runs. Through evaluating deviations from ideal curves, manufacturers are able to identify defects, improve processes, and guarantee the safety and reliability of finished products.
Failure Analysis
The stress-strain curve contributes to failure analysis by locating the level of stress and strain at which a material will fail. By comparing actual failure information with standard curves, engineers can ascertain whether failure was caused by overload, defects in the material, or faulty design, which contributes to safety and reliability in engineering use.
Conclusion
In summary, the stress-strain curve is a basic material science and engineering tool that shows how materials respond to load. It assists in determining significant properties such as elasticity, yield strength, and fracture points, thus aiding in material choice and design. Knowledge of this curve ensures safer, more effective, and economical structural and mechanical devices.
Also Read:
What is Laminar Air Flow?
What is Moisture Meter?
What is PH Meter?
What is Ash Value?
What is Compressive Strength?
What is ESCR?
What is a Water Bath?
What is Melt Flow Rate?